
Follow the transformation
Load raw sales rows into an Excel Table.
Validate dates, numeric amounts, categories and duplicate keys.
Add only clearly defined derived columns.
A sales-performance workbook integrates data cleaning, structured tables, formulas, PivotTables and charts into one auditable analytical product.
A sales-performance workbook integrates data cleaning, structured tables, formulas, PivotTables and charts into one auditable analytical product. The raw-data sheet should remain distinct from derived analysis and presentation so source values can be refreshed without manually repairing formulas.
Learning goal: explain why Spreadsheet Mini Project Sales Performance Workbook behaves this way, apply it to a small example, and verify the result independently. Begin by being able to justify this first step: Load raw sales rows into an Excel Table.
Treat this as a sequence of observable decisions rather than one opaque command. Stage 1: Load raw sales rows into an Excel Table. Stage 2: Validate dates, numeric amounts, categories and duplicate keys. Stage 3: Add only clearly defined derived columns. Final checkpoint: Recalculate or refresh after a source change to verify the workbook is connected end to end.
Load raw sales rows into an Excel Table.
Validate dates, numeric amounts, categories and duplicate keys.
Add only clearly defined derived columns.
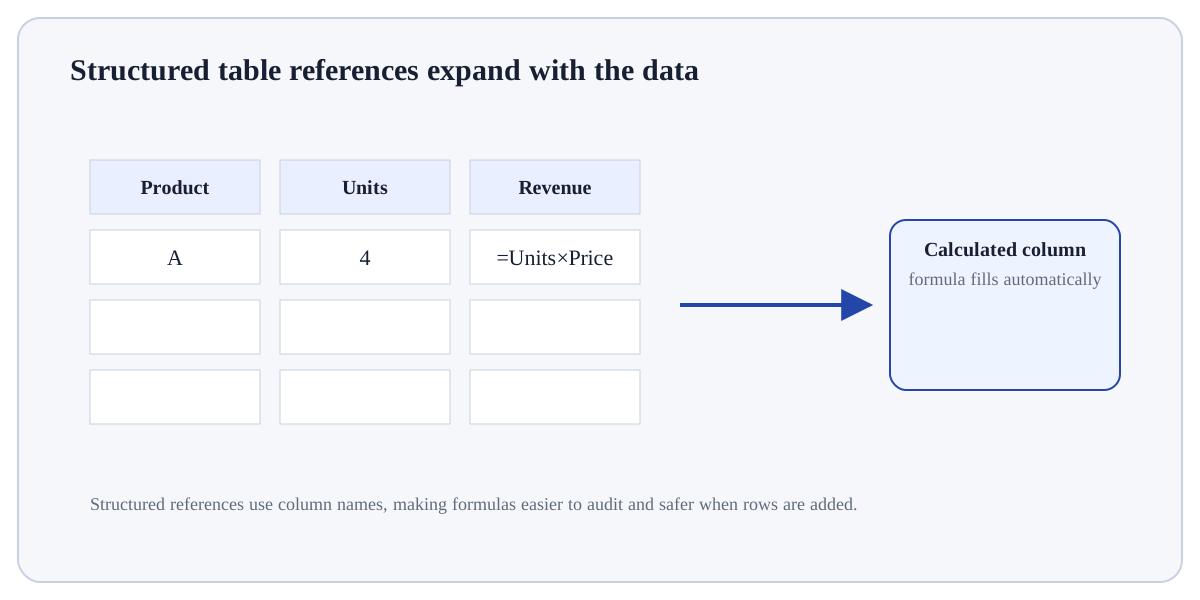
Load raw sales rows into an Excel Table. This is an input-preparation stage for Spreadsheet Mini Project Sales Performance Workbook. Verify the relevant type, shape, units, keys, missingness or assumptions before later steps depend on them.
Raw table → quality checks → KPI/PivotTable → chart → findingA reviewer should be able to trace every headline number back to the structured source rows.
For Spreadsheet Mini Project Sales Performance Workbook, trace the specific input through the mechanism above and independently verify one returned value, state change or side effect.
DefinitionThe exact metric/selection/comparison being computed.EvidenceTable, formula or visual that answers the question.AuditIndependent count/total/rule check that can reveal an error.Use Spreadsheet Mini Project Sales Performance Workbook when it answers a defined question in Excel & Spreadsheet Analytics and its inputs/assumptions match the current data or program state.
Reconsider Spreadsheet Mini Project Sales Performance Workbook when the required information is unavailable, the operation would violate a validation/data boundary, or a simpler operation answers the question more transparently.
Construct a tiny example of Spreadsheet Mini Project Sales Performance Workbook. First load raw sales rows into an Excel Table. Then validate dates, numeric amounts, categories and duplicate keys. Predict the result before execution and explain one boundary or failure case.
Which approach best demonstrates understanding of Spreadsheet Mini Project Sales Performance Workbook?
Step 1Load raw sales rows into an Excel Table.Step 2Validate dates, numeric amounts, categories and duplicate keys.Step 3Add only clearly defined derived columns.Step 4Build PivotTables/KPIs from the structured table.