Data Cleaning & Missing Data · Lesson 40

Detect Missing Values

Detect Missing Values is part of pandas' labelled table model.

ConceptWorked examplePracticeKnowledge check
Textbook walkthrough

What Detect Missing Values actually means

Detect Missing Values is part of pandas' labelled table model. A DataFrame stores columns with names and dtypes plus a row index; Series objects represent individual labelled columns. Most analytical operations transform one table into another, so row identity, column meaning and join cardinality must remain explicit.

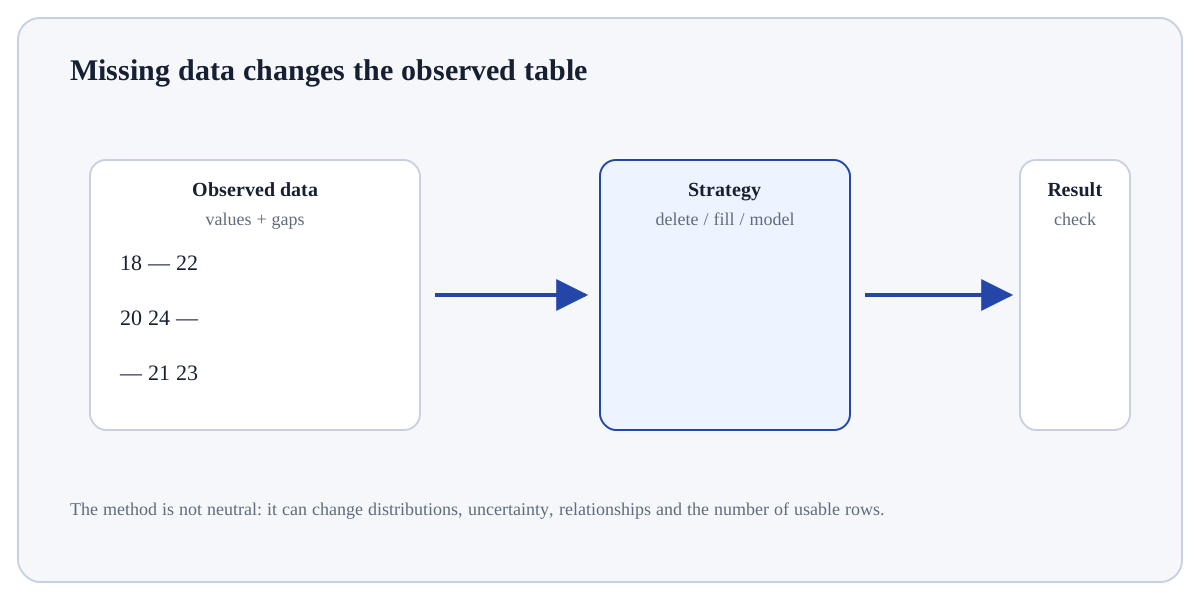
Detect Missing Values matters because missing, duplicated, inconsistent or extreme values are evidence about the data-generating process, not merely inconveniences to delete. Treatment choices can change populations and conclusions.

Deeper walkthrough

Read Detect Missing Values as a mechanism, not a recipe

Treat this as a sequence of observable decisions rather than one opaque command. Stage 1: Inspect head(), shape, dtypes and missingness before transforming the table. Stage 2: Select columns/rows explicitly and avoid chained operations whose meaning is unclear. Stage 3: Use vectorised column operations or groupby/aggregation for table-scale transformations. Final checkpoint: Validate row counts, uniqueness and missing values after the operation.

Mechanism

Follow the transformation

Inspect head(), shape, dtypes and missingness before transforming the table.

Select columns/rows explicitly and avoid chained operations whose meaning is unclear.

Use vectorised column operations or groupby/aggregation for table-scale transformations.

Evidence

Know what would convince you

  • Compare missingness, distributions, row counts and key constraints before and after the change.
  • Inspect representative changed rows and confirm the rule with domain/data documentation.
Useful distinctionfilter: Keep rows satisfying a condition.
Visual demonstration of Detect Missing Values
Visual demonstration: use the diagram to trace the main objects and state changes involved in Detect Missing Values.
Click a stage to inspect what happens, what changes, and what should be checked before moving on.
Stage 1

Inspect head()

Inspect head(), shape, dtypes and missingness before transforming the table. For Detect Missing Values, make this checkpoint explicit by recording the evidence inspected, the expected result, and the condition that would make you reject the current result.

Verification focus: record the evidence you inspected and the condition that would make this stage fail.
How it works

Trace the mechanism step by step

  1. Inspect head(), shape, dtypes and missingness before transforming the table.
  2. Select columns/rows explicitly and avoid chained operations whose meaning is unclear.
  3. Use vectorised column operations or groupby/aggregation for table-scale transformations.
  4. For merges, identify the key and expected one-to-one, one-to-many or many-to-many relationship before joining.
  5. Validate row counts, uniqueness and missing values after the operation.
Worked demonstration

Make the concept concrete

Demonstration

Python / pandas example

# Step 1 — Import the module so its functions/classes are available to the rest of this example.
import pandas as pd
# Step 2 — Construct `df` as a tabular object with named columns for inspectable analysis.
df = pd.DataFrame({
    "region": ["East", "West", "East", "West"],
    "sales": [120, 90, 150, 110]
})
# Step 3 — Split rows into groups so the following aggregation/transformation can be computed per group.
summary = (df.groupby("region", as_index=False)
             .agg(total_sales=("sales", "sum"),
                  mean_sales=("sales", "mean")))
# Step 4 — Display the current value explicitly so the result/state can be inspected during execution.
print(summary)
Expected / illustrative result
  region  total_sales  mean_sales
0   East          270       135.0
1   West          200       100.0
Interpret the result.

For Detect Missing Values, trace representative source rows/columns into the result and reconcile row counts, dtypes, keys or missing values that the operation could change.

Distinctions & related ideas

Know what this is — and what it is not

filterKeep rows satisfying a condition.
groupbySplit rows by key, apply an aggregation/transformation, combine results.
mergeMatch rows from two tables using one or more keys.
pivot/meltMove between long and wide representations without changing the underlying observations.
Use deliberately

When it is appropriate

Use Detect Missing Values when it helps diagnose, document or correct a data-quality issue without destroying information needed for the downstream question.

Boundary conditions

When to stop or reconsider

Do not “clean” automatically when the apparent anomaly may carry signal, reflect data collection, or require domain adjudication; preserve an audit trail of changes.

Common mistakes

Failure modes to recognise

  • Treating missing values, outliers or labels as purely technical defects without investigating how they were generated.
  • Applying learned cleaning/imputation using information from validation/test data.
  • Changing values without recording which rows changed and how distributions/counts were affected.
Verification

How to check the result

  • Compare missingness, distributions, row counts and key constraints before and after the change.
  • Inspect representative changed rows and confirm the rule with domain/data documentation.
  • In predictive work, fit learned cleaning only on training data and verify the pipeline reproduces that boundary.
Hands-on practice

Demonstrate understanding

Try this:

Build a tiny, inspectable example of Detect Missing Values. First inspect head(), shape, dtypes and missingness before transforming the table. Then select columns/rows explicitly and avoid chained operations whose meaning is unclear. Write the expected result before running it, and explain one condition that would make the result misleading or invalid.

Start by measuring the problem, not fixing it. Keep a before/after table of counts or distributions and inspect the exact records affected by the rule.
Knowledge check

Check reasoning, not memorisation

Before trusting a result from Detect Missing Values, which check provides the strongest evidence that you understand and applied it correctly?

Quick reference

Keep the important distinctions visible

Step 1Inspect head(), shape, dtypes and missingness before transforming the table.
Step 2Select columns/rows explicitly and avoid chained operations whose meaning is unclear.
Step 3Use vectorised column operations or groupby/aggregation for table-scale transformations.
Step 4For merges, identify the key and expected one-to-one, one-to-many or many-to-many relationship before joining.
Lesson summary

What to remember

  • Detect Missing Values is part of pandas' labelled table model. A DataFrame stores columns with names and dtypes plus a row index; Series objects represent individual labelled columns. Most analytical operations transform one table into another, so row identity, column meaning and join cardinality must remain explicit.
  • Inspect head(), shape, dtypes and missingness before transforming the table.
  • Treating missing values, outliers or labels as purely technical defects without investigating how they were generated.
  • Compare missingness, distributions, row counts and key constraints before and after the change.