Correlation summarises the direction and strength of association between variables.
ConceptWorked examplePracticeKnowledge check
Textbook walkthrough
What Correlation actually means
Correlation summarises the direction and strength of association between variables. Pearson correlation measures linear association on the original numeric scale; Spearman correlation measures monotonic association after converting values to ranks. A coefficient is not a causal estimate and should be interpreted together with the scatter plot and data-generating context.
Correlation matters because exploratory analysis is where structure, anomalies and plausible relationships become visible before stronger claims are made. The goal is to generate and test questions while preserving uncertainty and data-quality context.
Deeper walkthrough
Read Correlation as a mechanism, not a recipe
Treat this as a sequence of observable decisions rather than one opaque command. Stage 1: Pair observations correctly and handle missing pairs deliberately. Stage 2: Plot the variables to check shape, clusters and outliers. Stage 3: Compute Pearson r for linear association or Spearman rho for monotonic ranked association when appropriate. Final checkpoint: Never turn correlation into a causal statement without a design that identifies causality.
Mechanism
Follow the transformation
Pair observations correctly and handle missing pairs deliberately.
Plot the variables to check shape, clusters and outliers.
Compute Pearson r for linear association or Spearman rho for monotonic ranked association when appropriate.
Evidence
Know what would convince you
Compare row/column counts, dtypes and missing values before and after the operation.
Trace a few representative rows or one group manually from source values to result.
Useful distinctionUnivariate: One variable: distribution, counts, centre and spread.
Visual demonstration: use the diagram to trace the main objects and state changes involved in Correlation.
Click a stage to inspect what happens, what changes, and what should be checked before moving on.
Stage 1
Pair observations correctly and handle missing…
Pair observations correctly and handle missing pairs deliberately. This is an input-preparation stage for Correlation. Verify the relevant type, shape, units, keys, missingness or assumptions before later steps depend on them.
Input focus: confirm the data/object, units, type, shape and assumptions before the next operation depends on them.
Mathematical / formal view
Pearson r = covariance(X, Y) / (standard deviation(X) × standard deviation(Y)); therefore r is unitless and lies between -1 and 1.
How it works
Trace the mechanism step by step
Pair observations correctly and handle missing pairs deliberately.
Plot the variables to check shape, clusters and outliers.
Compute Pearson r for linear association or Spearman rho for monotonic ranked association when appropriate.
Interpret sign as direction and magnitude as strength relative to context.
Check whether subgroups or influential points change the coefficient.
Never turn correlation into a causal statement without a design that identifies causality.
Worked demonstration
Make the concept concrete
Demonstration
Python / pandas example
# Step 1 — Import the module so its functions/classes are available to the rest of this example.
import pandas as pd
# Step 2 — Construct `df` as a tabular object with named columns for inspectable analysis.
df = pd.DataFrame({"x":[1,2,3,4,5], "y":[2,3,5,8,12]})
# Step 3 — Display the current value explicitly so the result/state can be inspected during execution.
print("Pearson:", round(df["x"].corr(df["y"], method="pearson"), 3))
# Step 4 — Display the current value explicitly so the result/state can be inspected during execution.
print("Spearman:", round(df["x"].corr(df["y"], method="spearman"), 3))
Expected / illustrative result
Pearson: about 0.98
Spearman: 1.0
The relationship is perfectly monotonic but not perfectly linear.
Interpret the result.
For Correlation, trace representative source rows/columns into the result and reconcile row counts, dtypes, keys or missing values that the operation could change.
Distinctions & related ideas
Know what this is — and what it is not
UnivariateOne variable: distribution, counts, centre and spread.
BivariateTwo variables: association or group differences.
Confirmatory analysisTests or models a pre-specified claim; should be distinguished from open-ended exploration.
Use deliberately
When it is appropriate
Use Correlation when the data are naturally tabular and row grain, column meaning, keys and dtypes can be stated explicitly.
Boundary conditions
When to stop or reconsider
Reconsider the operation if row identity/grain is unclear, join keys are not validated, chained transformations hide state, or the task is better expressed with a simpler table operation.
Common mistakes
Failure modes to recognise
Changing row grain or row count without noticing it.
Joining/grouping on keys whose uniqueness or missingness was never checked.
Interpreting a derived column or aggregation without reconciling it to source rows and units.
Verification
How to check the result
Compare row/column counts, dtypes and missing values before and after the operation.
Trace a few representative rows or one group manually from source values to result.
For joins/reshapes/grouping, verify key uniqueness/cardinality and reconcile totals where totals should be preserved.
Correlation analysis
Read the coefficient together with the scatter plot
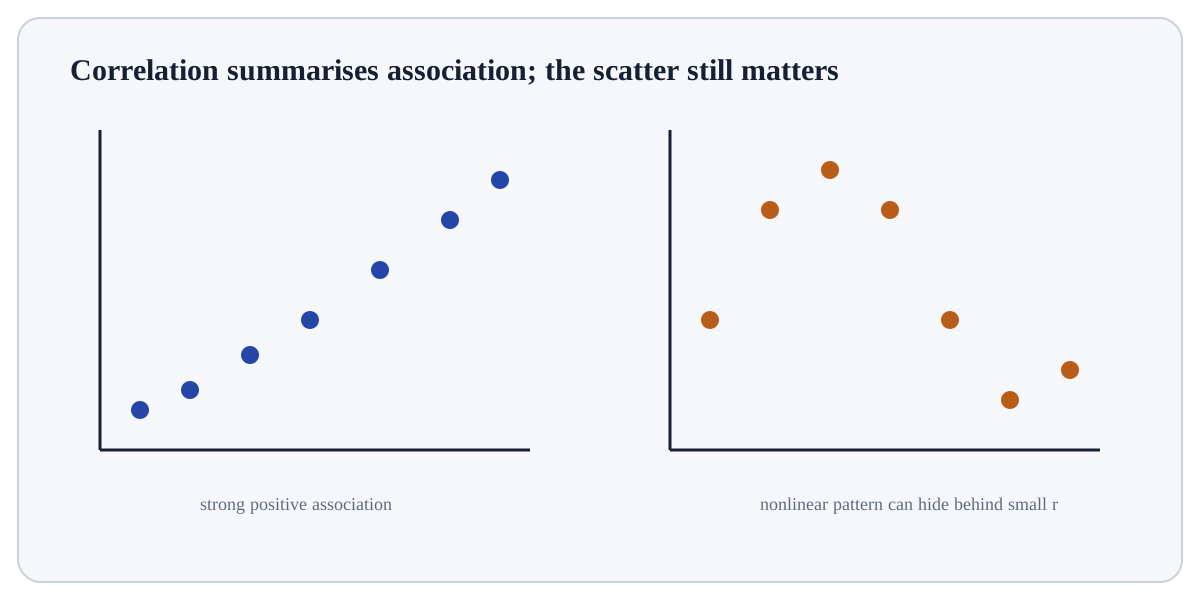
A correlation coefficient compresses a relationship into one number. Use the plot to check direction, linearity, clusters, influential outliers and whether a single summary is appropriate.
Pearson rLinear association between numeric variables.Spearman ρMonotonic association after converting values to ranks.InterpretationSign = direction; magnitude = strength. Correlation does not establish causality.
Current Pearson r—
Important
A near-zero Pearson correlation does not prove “no relationship”: the association may be nonlinear. An extreme observation can also change r substantially.
Build a tiny, inspectable example of Correlation. First pair observations correctly and handle missing pairs deliberately. Then plot the variables to check shape, clusters and outliers. Write the expected result before running it, and explain one condition that would make the result misleading or invalid.
Work with 4–8 rows that contain the exact key/category/missing-value pattern you want to understand. Trace one row or group all the way through.
Knowledge check
Check reasoning, not memorisation
Before trusting a result from Correlation, which check provides the strongest evidence that you understand and applied it correctly?
Quick reference
Keep the important distinctions visible
Step 1Pair observations correctly and handle missing pairs deliberately.
Step 2Plot the variables to check shape, clusters and outliers.
Step 3Compute Pearson r for linear association or Spearman rho for monotonic ranked association when appropriate.
Step 4Interpret sign as direction and magnitude as strength relative to context.
Lesson summary
What to remember
Correlation summarises the direction and strength of association between variables. Pearson correlation measures linear association on the original numeric scale; Spearman correlation measures monotonic association after converting values to ranks. A coefficient is not a causal estimate and should be interpreted together with the scatter plot and data-generating context.
Pair observations correctly and handle missing pairs deliberately.
Changing row grain or row count without noticing it.
Compare row/column counts, dtypes and missing values before and after the operation.