Business Analysis · Lesson 75

Time Series Trend and Seasonality

Time Series Trend and Seasonality is a business-analysis pattern that converts event or transactional data into a decision-focused measure.

ConceptWorked examplePracticeKnowledge check
Textbook walkthrough

What Time Series Trend and Seasonality actually means

Time Series Trend and Seasonality is a business-analysis pattern that converts event or transactional data into a decision-focused measure. The numerator, denominator, cohort definition and time window must be explicit for the metric to be comparable.

Time Series Trend and Seasonality matters because business metrics are often ratios, cohorts or event sequences whose meaning depends on denominator, time window and eligibility rules. Those definitions must stay stable before segments or periods can be compared.

Deeper walkthrough

Read Time Series Trend and Seasonality as a mechanism, not a recipe

Treat this as a sequence of observable decisions rather than one opaque command. Stage 1: Define the entity and event that counts. Stage 2: Define the denominator/population at risk. Stage 3: Choose a time window and cohort boundary. Final checkpoint: Connect the pattern to a decision rather than reporting a number alone.

Mechanism

Follow the transformation

Define the entity and event that counts.

Define the denominator/population at risk.

Choose a time window and cohort boundary.
Evidence

Know what would convince you

  • Write the decision question, unit of analysis and metric formula in plain language before computing it.
  • Reconcile KPI numerators/denominators or grouped totals to source counts for a small slice.
Useful distinctionRate: Events or successes divided by an eligible population.
Visual demonstration of Time Series Trend and Seasonality
Visual demonstration: use the diagram to trace the main objects and state changes involved in Time Series Trend and Seasonality.
Click a stage to inspect what happens, what changes, and what should be checked before moving on.
Stage 1

Define the entity and event that…

Define the entity and event that counts. This is an input-preparation stage for Time Series Trend and Seasonality. Verify the relevant type, shape, units, keys, missingness or assumptions before later steps depend on them.

Input focus: confirm the data/object, units, type, shape and assumptions before the next operation depends on them.
How it works

Trace the mechanism step by step

  1. Define the entity and event that counts.
  2. Define the denominator/population at risk.
  3. Choose a time window and cohort boundary.
  4. Calculate the measure by relevant segment.
  5. Check denominator size, survivorship and calendar effects.
  6. Connect the pattern to a decision rather than reporting a number alone.
Worked demonstration

Make the concept concrete

Demonstration

Text example

Observed series = long-run level/trend + repeating seasonal pattern + irregular remainder.
Example: monthly ice-cream sales may rise over years (trend) and peak every summer (seasonality).
Expected / illustrative result
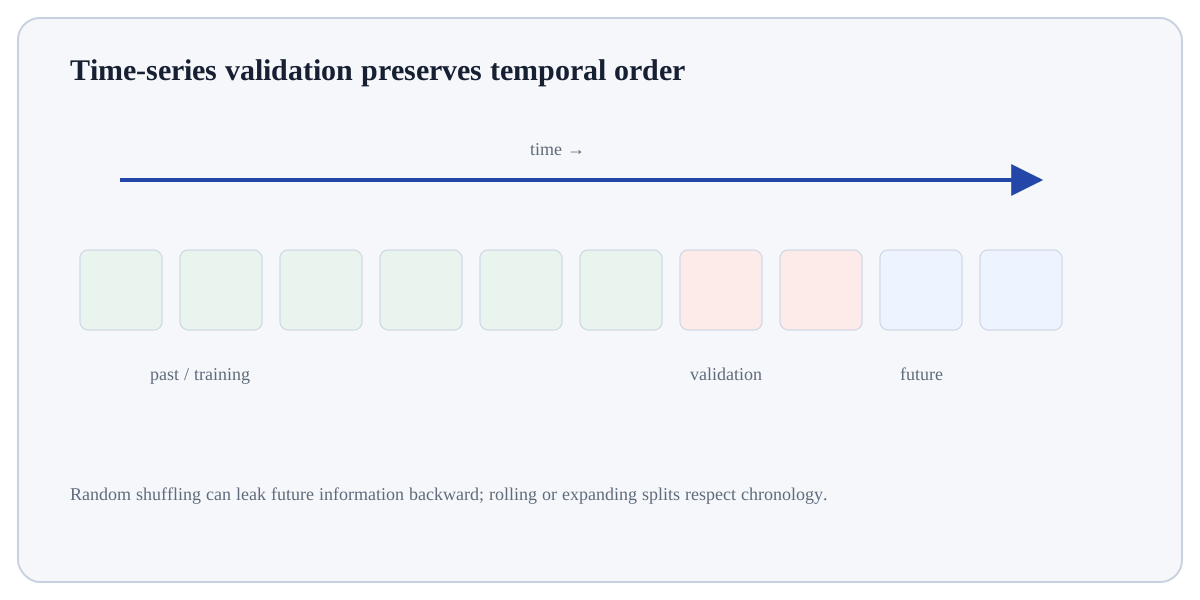
Compare equivalent seasons and use time-aware validation; random row splits can leak future structure.
Interpret the result.

For Time Series Trend and Seasonality, connect the displayed result to the specific input and mechanism above; independently verify one value/state change rather than treating successful execution as proof.

Distinctions & related ideas

Know what this is — and what it is not

RateEvents or successes divided by an eligible population.
GrowthRelative or absolute change between periods.
RetentionShare of an initial cohort still active at a later period.
Funnel conversionShare progressing from one defined stage to the next.
Use deliberately

When it is appropriate

Use Time Series Trend and Seasonality when it connects a clearly framed stakeholder question to measurable evidence and an action or decision.

Boundary conditions

When to stop or reconsider

Reframe the analysis if the decision, unit of analysis, metric definition, comparison group or time window is still ambiguous; more computation will not repair an undefined question.

Common mistakes

Failure modes to recognise

  • Starting with a favourite chart/tool before defining the decision and unit of analysis.
  • Using an undefined KPI, denominator, cohort or time window and then comparing incomparable numbers.
  • Turning association or a descriptive pattern into a causal recommendation without supporting design/evidence.
Verification

How to check the result

  • Write the decision question, unit of analysis and metric formula in plain language before computing it.
  • Reconcile KPI numerators/denominators or grouped totals to source counts for a small slice.
  • Test whether the conclusion changes under one reasonable alternative definition or comparison window.
Hands-on practice

Demonstrate understanding

Try this:

Build a tiny, inspectable example of Time Series Trend and Seasonality. First define the entity and event that counts. Then define the denominator/population at risk. Write the expected result before running it, and explain one condition that would make the result misleading or invalid.

Write the decision, unit and metric definition first. Use a tiny slice where you can recompute the KPI/table manually and explain what would change the recommendation.
Knowledge check

Check reasoning, not memorisation

Before trusting a result from Time Series Trend and Seasonality, which check provides the strongest evidence that you understand and applied it correctly?

Quick reference

Keep the important distinctions visible

Step 1Define the entity and event that counts.
Step 2Define the denominator/population at risk.
Step 3Choose a time window and cohort boundary.
Step 4Calculate the measure by relevant segment.
Lesson summary

What to remember

  • Time Series Trend and Seasonality is a business-analysis pattern that converts event or transactional data into a decision-focused measure. The numerator, denominator, cohort definition and time window must be explicit for the metric to be comparable.
  • Define the entity and event that counts.
  • Starting with a favourite chart/tool before defining the decision and unit of analysis.
  • Write the decision question, unit of analysis and metric formula in plain language before computing it.