
Follow the transformation
Inspect schema, unit of analysis and target definition.
Measure missingness, duplicates, class balance and impossible values.
Study univariate distributions and subgroup differences.
Bivariate Analysis is a data-understanding step that examines whether the dataset accurately represents the problem you intend to model.
Bivariate Analysis is a data-understanding step that examines whether the dataset accurately represents the problem you intend to model. EDA is not merely plotting; it is a search for structure, quality problems and leakage risks that can invalidate later evaluation.
Bivariate Analysis matters because model quality cannot exceed the meaning and integrity of its data. Profiling, EDA, label checks and leakage checks expose problems that a sophisticated algorithm may otherwise exploit or hide.
Treat this as a sequence of observable decisions rather than one opaque command. Stage 1: Inspect schema, unit of analysis and target definition. Stage 2: Measure missingness, duplicates, class balance and impossible values. Stage 3: Study univariate distributions and subgroup differences. Final checkpoint: Audit timestamps and data provenance for information that would not exist at prediction time.
Inspect schema, unit of analysis and target definition.
Measure missingness, duplicates, class balance and impossible values.
Study univariate distributions and subgroup differences.
Inspect schema, unit of analysis and target definition. For Bivariate Analysis, make this checkpoint explicit by recording the evidence inspected, the expected result, and the condition that would make you reject the current result.
Overall: X and Y appear positively associated.
Within subgroup A: weak association.
Within subgroup B: weak association.
The overall trend may be driven by subgroup separation rather than within-group relationship.Multivariate analysis checks whether a bivariate pattern persists after conditioning on other variables or groups.
For Bivariate Analysis, trace representative source rows/columns into the result and reconcile row counts, dtypes, keys or missing values that the operation could change.
QuestionAsk what the operation is intended to answer.MechanismTrace the rule from input to output.EvidenceInspect a value, table, plot, error or metric that can falsify your expectation.Use Bivariate Analysis when it helps diagnose, document or correct a data-quality issue without destroying information needed for the downstream question.
Do not “clean” automatically when the apparent anomaly may carry signal, reflect data collection, or require domain adjudication; preserve an audit trail of changes.
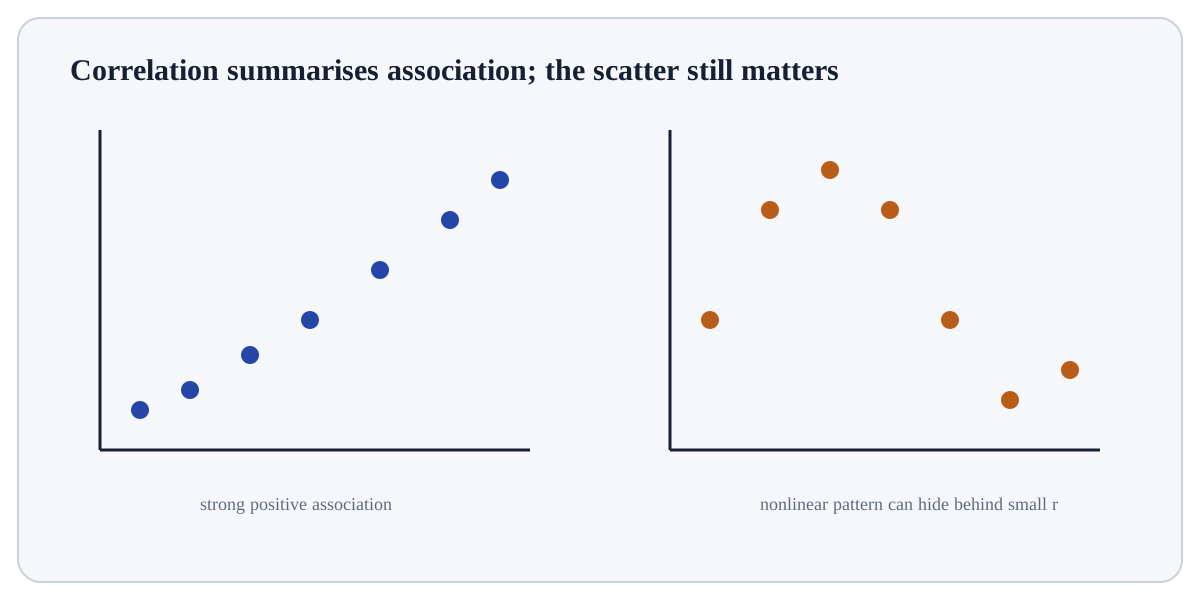
For two numeric variables, start with a scatter plot, then calculate Pearson correlation when a linear summary is appropriate or Spearman correlation when rank-based monotonic association is more suitable.
Build a tiny, inspectable example of Bivariate Analysis. First inspect schema, unit of analysis and target definition. Then measure missingness, duplicates, class balance and impossible values. Write the expected result before running it, and explain one condition that would make the result misleading or invalid.
Before trusting a result from Bivariate Analysis, which check provides the strongest evidence that you understand and applied it correctly?
Step 1Inspect schema, unit of analysis and target definition.Step 2Measure missingness, duplicates, class balance and impossible values.Step 3Study univariate distributions and subgroup differences.Step 4Use bivariate/multivariate views to identify associations, nonlinearities and confounding structure.