
Follow the transformation
Measure the problem by column, row group and time/segment.
Investigate the data-generating process before choosing a fix.
Choose deletion, correction, imputation, transformation or retention with an explicit reason.
Simple Imputation is a data-quality decision, not merely a cleaning command.
Simple Imputation is a data-quality decision, not merely a cleaning command. The correct treatment depends on how the issue arose, whether it carries information, and how the treatment changes the population or downstream model.
Simple Imputation matters because missingness changes both the available sample and the information contained in each feature. Imputation is a modelling decision whose assumptions and validation boundary can affect bias and predictive performance.
Treat this as a sequence of observable decisions rather than one opaque command. Stage 1: Measure the problem by column, row group and time/segment. Stage 2: Investigate the data-generating process before choosing a fix. Stage 3: Choose deletion, correction, imputation, transformation or retention with an explicit reason. Final checkpoint: Record an indicator or audit trail when the fact that a value was missing/changed may itself matter.
Measure the problem by column, row group and time/segment.
Investigate the data-generating process before choosing a fix.
Choose deletion, correction, imputation, transformation or retention with an explicit reason.
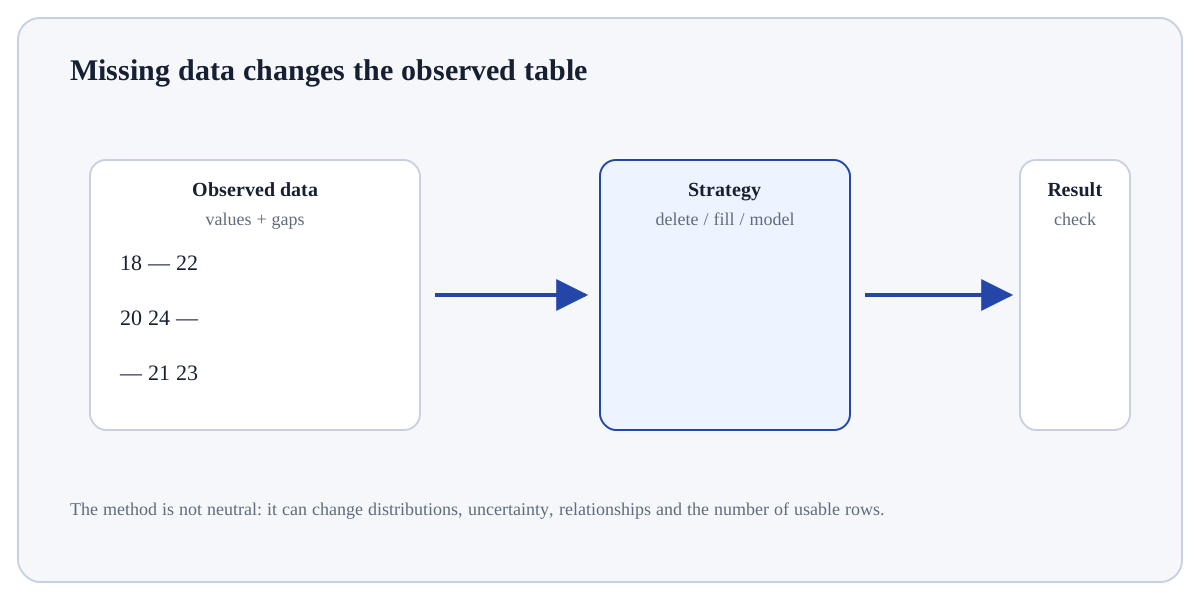
Measure the problem by column, row group and time/segment. For Simple Imputation, identify the exact state before this stage, the operation or rule applied here, and the observable state afterwards so the mechanism remains inspectable.
# Step 1 — Import the module so its functions/classes are available to the rest of this example.
import pandas as pd
# Step 2 — Compute the right-hand expression and store its result in `s` for the next step.
s = pd.Series([10, 11, None, 40])
# Step 3 — Display the current value explicitly so the result/state can be inspected during execution.
print("mean fill:", s.fillna(s.mean()).tolist())
# Step 4 — Display the current value explicitly so the result/state can be inspected during execution.
print("median fill:", s.fillna(s.median()).tolist())Mean and median produce different imputations because 40 pulls the mean upward.
For Simple Imputation, trace representative source rows/columns into the result and reconcile row counts, dtypes, keys or missing values that the operation could change.
DeletionRemoves affected rows/columns; can bias the population.Simple imputationUses a fixed statistic/category; easy but shrinks variability.Model-based imputationUses relationships with other variables; more assumptions and leakage risk.Missing indicatorPreserves information about whether a value was missing.Use Simple Imputation when it helps diagnose, document or correct a data-quality issue without destroying information needed for the downstream question.
Do not “clean” automatically when the apparent anomaly may carry signal, reflect data collection, or require domain adjudication; preserve an audit trail of changes.
Build a tiny, inspectable example of Simple Imputation. First measure the problem by column, row group and time/segment. Then investigate the data-generating process before choosing a fix. Write the expected result before running it, and explain one condition that would make the result misleading or invalid.
Before trusting a result from Simple Imputation, which check provides the strongest evidence that you understand and applied it correctly?
Step 1Measure the problem by column, row group and time/segment.Step 2Investigate the data-generating process before choosing a fix.Step 3Choose deletion, correction, imputation, transformation or retention with an explicit reason.Step 4Fit learned preprocessing only on training data when predictive modelling is involved.