
Follow the transformation
Evaluate predictions on data not used to fit/tune the model.
Choose metrics that match the target type and decision costs.
Inspect distributions/residuals or threshold curves rather than one number.
Classification Metrics is part of model evaluation.
Classification Metrics is part of model evaluation. A metric is a compressed view of model behaviour, so reliable evaluation uses several complementary summaries plus plots and subgroup/error analysis.
Classification Metrics matters because a single metric compresses model behaviour. Diagnostics, curves, residuals, calibration, thresholds and subgroup results reveal different failure modes that can lead to different deployment decisions.
Treat this as a sequence of observable decisions rather than one opaque command. Stage 1: Evaluate predictions on data not used to fit/tune the model. Stage 2: Choose metrics that match the target type and decision costs. Stage 3: Inspect distributions/residuals or threshold curves rather than one number. Final checkpoint: Attach uncertainty to performance estimates when sample size or variability matters.
Evaluate predictions on data not used to fit/tune the model.
Choose metrics that match the target type and decision costs.
Inspect distributions/residuals or threshold curves rather than one number.
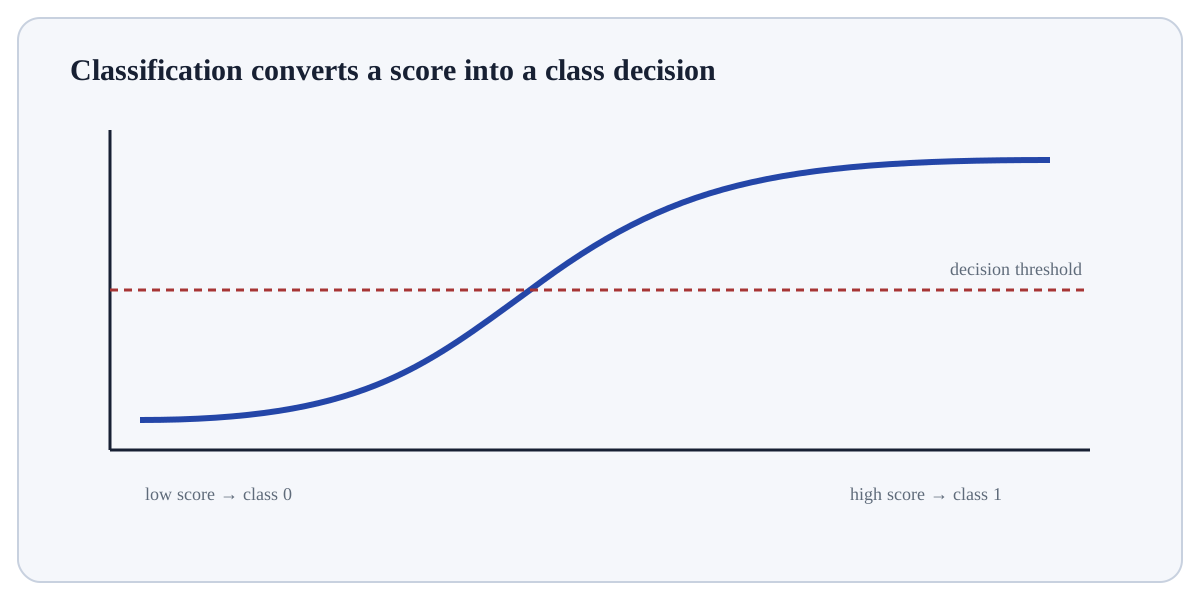
Evaluate predictions on data not used to fit/tune the model. At this stage of Classification Metrics, keep the incoming data or object separate from the learned parameter, transformed object, or statistic so the change can be reproduced and independently checked.
# Step 1 — Compute the right-hand expression and store its result in `tp,fp,fn,tn` for the next step.
tp,fp,fn,tn = 30,10,5,55
# Step 2 — Compute the right-hand expression and store its result in `precision` for the next step.
precision=tp/(tp+fp)
# Step 3 — Compute the right-hand expression and store its result in `recall` for the next step.
recall=tp/(tp+fn)
# Step 4 — Compute the right-hand expression and store its result in `accuracy` for the next step.
accuracy=(tp+tn)/(tp+fp+fn+tn)
# Step 5 — Display the current value explicitly so the result/state can be inspected during execution.
print(round(accuracy,3), round(precision,3), round(recall,3))accuracy=0.85, precision=0.75, recall≈0.857. The same confusion matrix supports multiple decision-relevant summaries.
For Classification Metrics, connect the reported result to the exact training/validation/prediction step that produced it and check one prediction, fold or metric component independently.
AccuracyShare of correct labels; can hide minority-class failure.PrecisionAmong predicted positives, fraction truly positive.RecallAmong actual positives, fraction detected.ROC-AUCRanking across thresholds; may look optimistic under severe imbalance.PR-AUCPrecision-recall trade-off; often more informative for rare positives.MAE/RMSEAbsolute vs squared-error regression summaries.Use Classification Metrics when the metric/diagnostic corresponds to the prediction type, positive class or business/scientific consequence that matters.
Do not compress performance to this measure alone when thresholds, class imbalance, calibration, subgroup behaviour or error costs change the decision.
Build a tiny, inspectable example of Classification Metrics. First evaluate predictions on data not used to fit/tune the model. Then choose metrics that match the target type and decision costs. Write the expected result before running it, and explain one condition that would make the result misleading or invalid.
Before trusting a result from Classification Metrics, which check provides the strongest evidence that you understand and applied it correctly?
Step 1Evaluate predictions on data not used to fit/tune the model.Step 2Choose metrics that match the target type and decision costs.Step 3Inspect distributions/residuals or threshold curves rather than one number.Step 4Check subgroup performance and calibration when predictions drive decisions.