
Follow the transformation
Create an array and inspect its shape.
Choose the statistic that answers the question.
Choose the axis that corresponds to the groups you intend to summarise.
NumPy aggregation functions reduce many array values to a summary such as sum, mean, minimum, maximum or standard deviation.
NumPy aggregation functions reduce many array values to a summary such as sum, mean, minimum, maximum or standard deviation. The axis argument controls which dimension is reduced: without an axis the whole array is summarised; with axis=0 or axis=1 a two-dimensional array produces column-wise or row-wise summaries.
Learning goal: explain why Aggregation Functions behaves this way, apply it to a small example, and verify the result independently. Begin by being able to justify this first step: Create an array and inspect its shape.
Treat this as a sequence of observable decisions rather than one opaque command. Stage 1: Create an array and inspect its shape. Stage 2: Choose the statistic that answers the question. Stage 3: Choose the axis that corresponds to the groups you intend to summarise. Final checkpoint: Check the output shape and one manually computable row/column.
Create an array and inspect its shape.
Choose the statistic that answers the question.
Choose the axis that corresponds to the groups you intend to summarise.
Create an array and inspect its shape. For Aggregation Functions, make this checkpoint explicit by recording the evidence inspected, the expected result, and the condition that would make you reject the current result.
# Step 1 — Import the module so its functions/classes are available to the rest of this example.
import numpy as np
# Step 2 — Construct `x` as an array so vectorised numerical operations can be applied consistently.
x = np.array([[1, 2, 3], [4, 5, 6]])
# Step 3 — Display the current value explicitly so the result/state can be inspected during execution.
print(x.mean())
# Step 4 — Display the current value explicitly so the result/state can be inspected during execution.
print(x.mean(axis=0))
# Step 5 — Display the current value explicitly so the result/state can be inspected during execution.
print(x.sum(axis=1))Overall mean is 3.5; column means are [2.5, 3.5, 4.5]; row sums are [6, 15].
For Aggregation Functions, trace representative input values into the result and verify shape, dtype, row grain, axis or key behaviour that the operation can change.
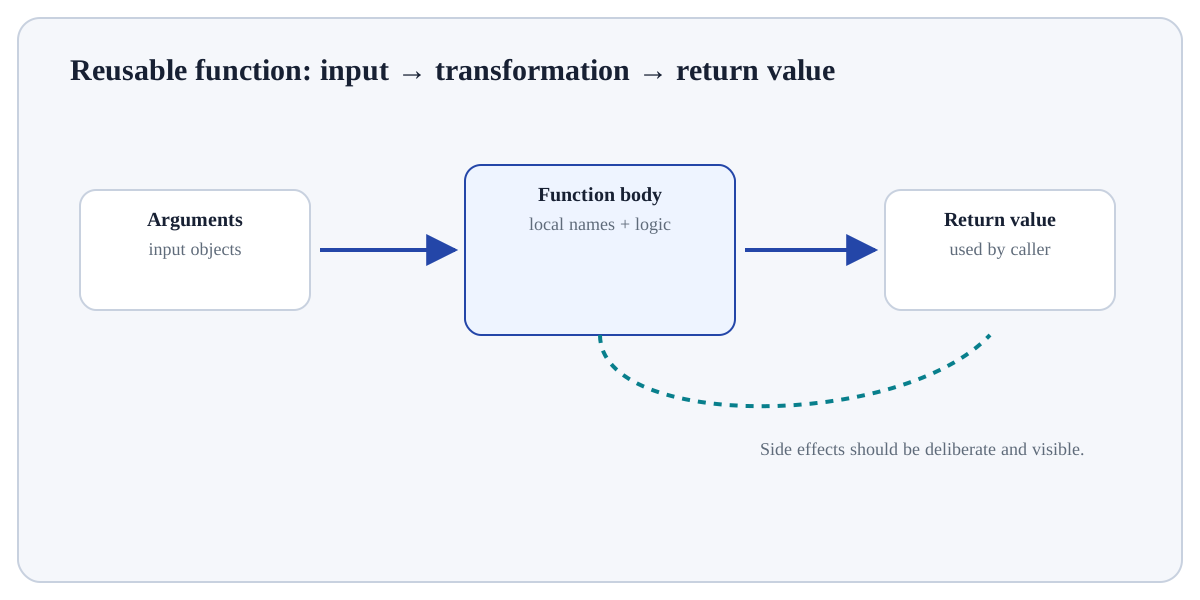
InputObjects/values supplied to the operation.StateNames or mutable objects that may change during execution.OutputReturned value, side effect, file, plot or exception to inspect.Use Aggregation Functions when it answers a defined question in NumPy for Numerical Computing and its inputs/assumptions match the current data or program state.
Reconsider Aggregation Functions when the required information is unavailable, the operation would violate a validation/data boundary, or a simpler operation answers the question more transparently.
Construct a tiny example of Aggregation Functions. First create an array and inspect its shape. Then choose the statistic that answers the question. Predict the result before execution and explain one boundary or failure case.
Which approach best demonstrates understanding of Aggregation Functions?
Step 1Create an array and inspect its shape.Step 2Choose the statistic that answers the question.Step 3Choose the axis that corresponds to the groups you intend to summarise.Step 4Use NaN-aware variants such as nanmean only when ignoring NaN is a deliberate rule.