How can information move across relationships rather than rows?
Start here
How can information move across relationships rather than rows?
GNNs update each node by combining its own representation with messages from neighbours. Repeating layers expands the receptive field through the graph.
Building interactive view…
Understand
Build the mental model
GNNs update each node by combining its own representation with messages from neighbours. Repeating layers expands the receptive field through the graph. Match graph construction to the real relational process. Too many layers can oversmooth node representations.
Click a stage to inspect what happens, what changes, and what should be checked before moving on.
Stage 1
Node/edge features
Identify exactly what enters this stage: its shape, type, scale, units and any missing or invalid values that could alter the next operation. Technical context for Graph Neural Networks: Message passing defines message, aggregation and update functions. GCN normalises neighbour aggregation; GAT learns attention weights; GIN uses expressive sum aggregation plus an MLP.
Practitioner checkpoint: Match graph construction to the real relational process. Too many layers can oversmooth node representations.
What happens if…?
Break the assumption deliberately
Add more message-passing layers and observe when node representations become too similar.
Move the control and explain what you expect before reading the visual.
Technical lens
Formalise what the visual is doing
Message passing defines message, aggregation and update functions. GCN normalises neighbour aggregation; GAT learns attention weights; GIN uses expressive sum aggregation plus an MLP.
Technical questionUse a tiny case to make the mechanism observable. Message passing defines message, aggregation and update functions. GCN normalises neighbour aggregation; GAT learns attention weights; GIN uses expressive sum aggregation plus an MLP. Verify one intermediate quantity, state change or mapping independently; then predict the consequence of this change: Add more message-passing layers and observe when node representations become too similar.
Practitioner lens
Use it responsibly
Match graph construction to the real relational process. Too many layers can oversmooth node representations.
Transfer testTransfer this idea to a new example and justify each decision using this practitioner rule: Match graph construction to the real relational process. Too many layers can oversmooth node representations. Then explain what should change if you deliberately test: Add more message-passing layers and observe when node representations become too similar.
Worked exploration
Use the visual as an experiment, not decoration
Create a graph with three nodes and edges A–B, B–C. After one message-passing layer, B aggregates information from A and C; after another, A can indirectly receive information originating at C.
Technical lens
Message passing defines message, aggregation and update functions. GCN normalises neighbour aggregation; GAT learns attention weights; GIN uses expressive sum aggregation plus an MLP.
Practitioner check
Match graph construction to the real relational process. Too many layers can oversmooth node representations.
Prediction before interaction
Add more message-passing layers and observe when node representations become too similar.
Exploration walkthrough
Turn the interaction into an evidence trail
Create a graph with three nodes and edges A–B, B–C. After one message-passing layer, B aggregates information from A and C; after another, A can indirectly receive information originating at C. Before moving the control, state your prediction. After the visual changes, name the specific state, statistic, boundary or mapping that changed and explain why that change is consistent—or inconsistent—with your prediction.
Record one observable quantity before the interaction and the same quantity afterwards.
Change one factor at a time so the causal effect of the control is inspectable.
Use an edge or failure case to discover where the concept stops behaving as the simple story suggests.
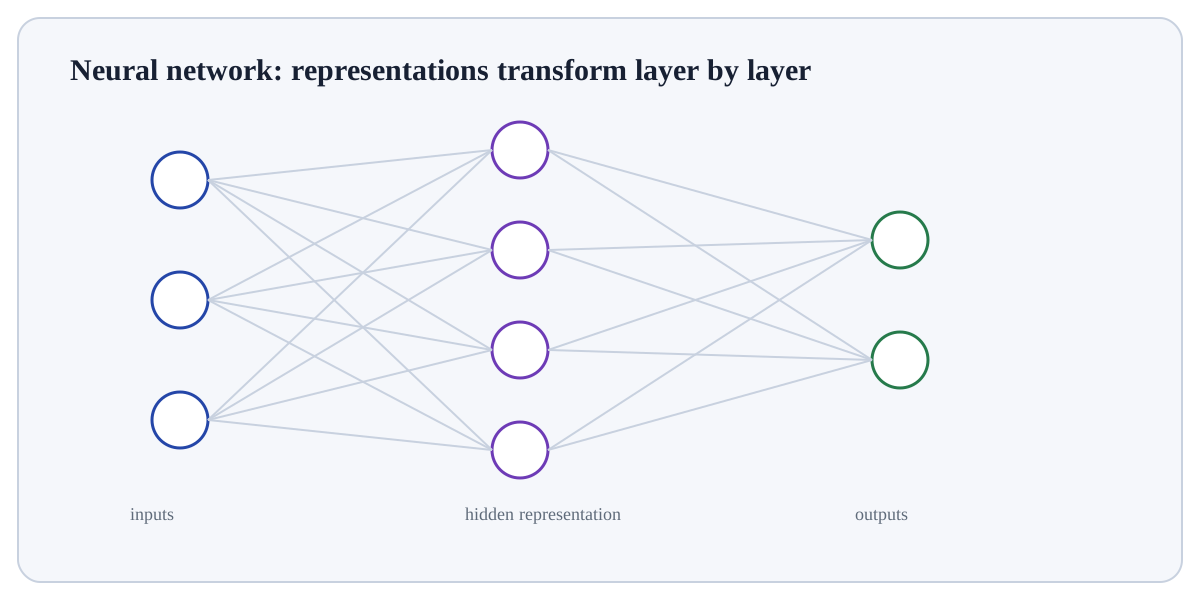
Static orientation diagram for Graph Neural Networks; use the interactive visual above to test how the relationships change.
Reference depth
Open the complete material
The flagship experience is the map. These pages contain the roads.