
Follow the transformation
Identify whether the data are naturally rectangular or nested.
Check delimiter, quoting, encoding and header rules for CSV.
Inspect object/array nesting for JSON before flattening.
CSV represents a rectangular table as delimited text; JSON represents nested objects/arrays with explicit structural syntax; a “tabular file” is any representation where rows are observations and columns are variables.
CSV represents a rectangular table as delimited text; JSON represents nested objects/arrays with explicit structural syntax; a “tabular file” is any representation where rows are observations and columns are variables. Choosing a format affects type preservation, nesting, interoperability and how reliably the schema can be reconstructed.
Learning goal: explain why CSV JSON and Tabular File Formats behaves this way, apply it to a small example, and verify the result independently. Begin by being able to justify this first step: Identify whether the data are naturally rectangular or nested.
Treat this as a sequence of observable decisions rather than one opaque command. Stage 1: Identify whether the data are naturally rectangular or nested. Stage 2: Check delimiter, quoting, encoding and header rules for CSV. Stage 3: Inspect object/array nesting for JSON before flattening. Final checkpoint: After loading, compare row/field counts and inferred types with the expected schema.
Identify whether the data are naturally rectangular or nested.
Check delimiter, quoting, encoding and header rules for CSV.
Inspect object/array nesting for JSON before flattening.
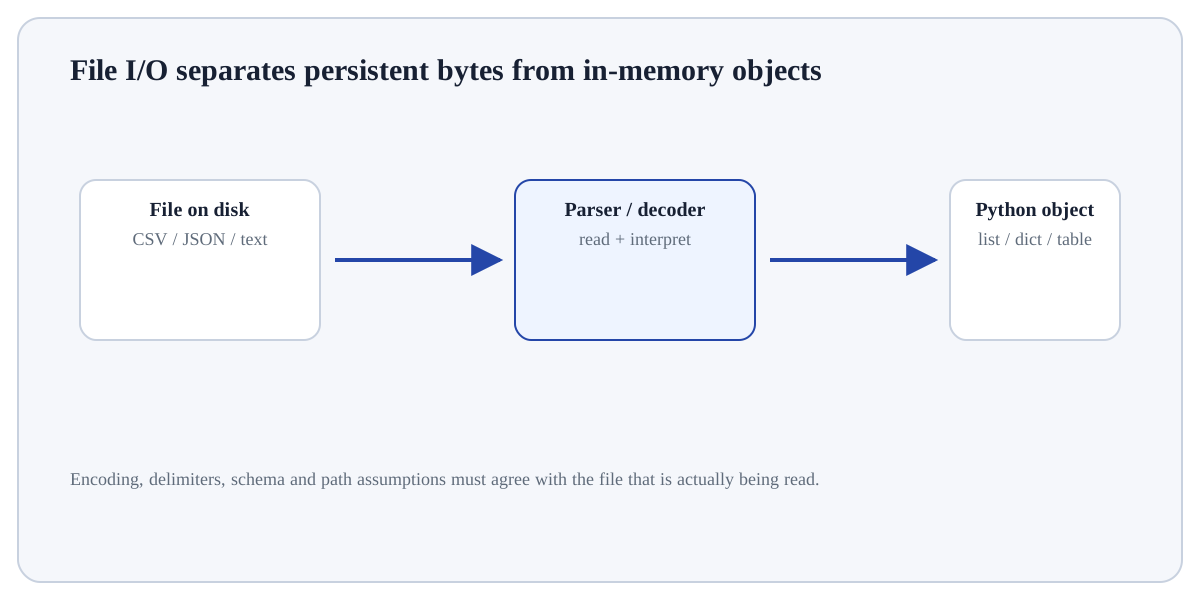
Identify whether the data are naturally rectangular or nested. This is an input-preparation stage for CSV JSON and Tabular File Formats. Verify the relevant type, shape, units, keys, missingness or assumptions before later steps depend on them.
CSV row: 101,East,25.5
JSON object: {"id":101,"region":"East","sales":25.5}Both can represent the same record, but JSON keeps named fields/nesting while CSV depends on column order/header and delimiter conventions.
For CSV JSON and Tabular File Formats, trace representative input values into the result and verify shape, dtype, row grain, axis or key behaviour that the operation can change.
DefinitionThe exact metric/selection/comparison being computed.EvidenceTable, formula or visual that answers the question.AuditIndependent count/total/rule check that can reveal an error.Use CSV JSON and Tabular File Formats when it answers a defined question in Reading & Understanding Data and its inputs/assumptions match the current data or program state.
Reconsider CSV JSON and Tabular File Formats when the required information is unavailable, the operation would violate a validation/data boundary, or a simpler operation answers the question more transparently.
Construct a tiny example of CSV JSON and Tabular File Formats. First identify whether the data are naturally rectangular or nested. Then check delimiter, quoting, encoding and header rules for CSV. Predict the result before execution and explain one boundary or failure case.
Which approach best demonstrates understanding of CSV JSON and Tabular File Formats?
Step 1Identify whether the data are naturally rectangular or nested.Step 2Check delimiter, quoting, encoding and header rules for CSV.Step 3Inspect object/array nesting for JSON before flattening.Step 4Do not assume text files preserve numeric/date types automatically.