
Follow the transformation
Build a design matrix from training features.
Fit coefficients using training data only.
Predict continuous values on held-out cases.
Linear regression predicts a continuous target as an intercept plus a weighted sum of features.
Linear regression predicts a continuous target as an intercept plus a weighted sum of features. Ordinary least squares estimates coefficients by minimising squared residual error.
Learning goal: explain why Linear Regression behaves this way, apply it to a small example, and verify the result independently. Begin by being able to justify this first step: Build a design matrix from training features.
Treat this as a sequence of observable decisions rather than one opaque command. Stage 1: Build a design matrix from training features. Stage 2: Fit coefficients using training data only. Stage 3: Predict continuous values on held-out cases. Final checkpoint: Compare against a simple baseline and consider regularisation when needed.
Build a design matrix from training features.
Fit coefficients using training data only.
Predict continuous values on held-out cases.
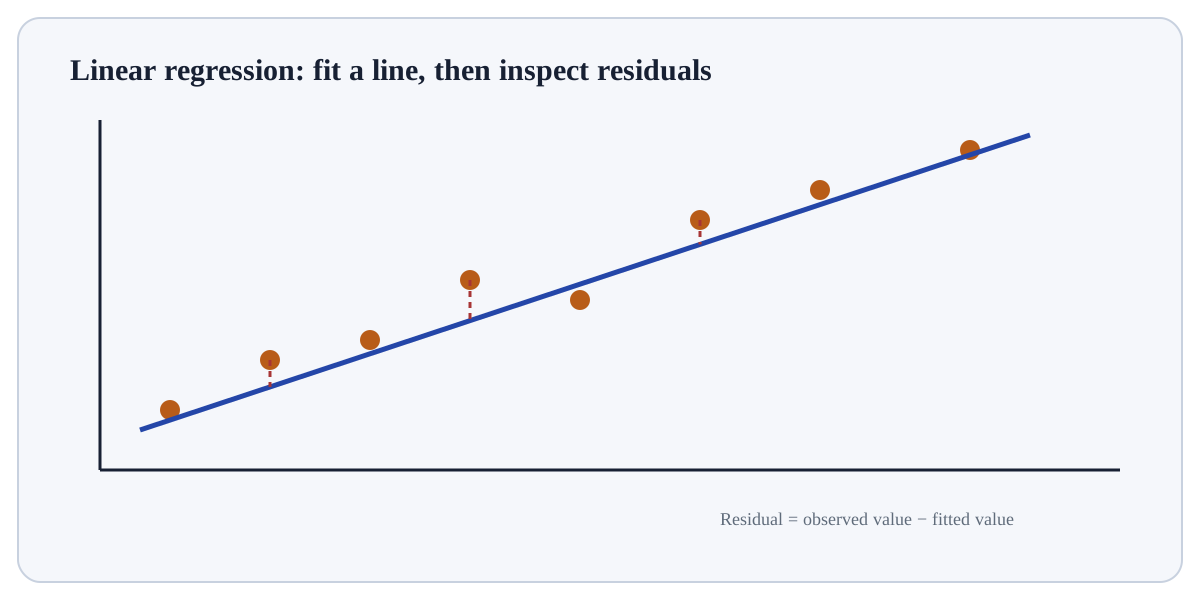
Build a design matrix from training features. At this stage of Linear Regression, keep the incoming data or object separate from the learned parameter, transformed object, or statistic so the change can be reproduced and independently checked.
For y ≈ 2x, training points (1,2), (2,4), (3,6) imply a slope near 2; x=4 should predict near 8.A tiny linear pattern makes the meaning of the fitted slope and residuals visible.
For Linear Regression, connect the result to the fitted state, held-out data or prediction rule that produced it and independently check one prediction, split or metric component.
Training evidenceInformation allowed to influence fitted state.Held-out evidenceIndependent observations used to estimate generalisation.InterpretationWhat the result supports, with assumptions and limitations.Use Linear Regression when it answers a defined question in Predictive Modelling and its inputs/assumptions match the current data or program state.
Reconsider Linear Regression when the required information is unavailable, the operation would violate a validation/data boundary, or a simpler operation answers the question more transparently.
Construct a tiny example of Linear Regression. First build a design matrix from training features. Then fit coefficients using training data only. Predict the result before execution and explain one boundary or failure case.
Which approach best demonstrates understanding of Linear Regression?
Step 1Build a design matrix from training features.Step 2Fit coefficients using training data only.Step 3Predict continuous values on held-out cases.Step 4Inspect residual patterns and scale-sensitive errors.