Why can many unstable trees become a stable model?
Start here
Why can many unstable trees become a stable model?
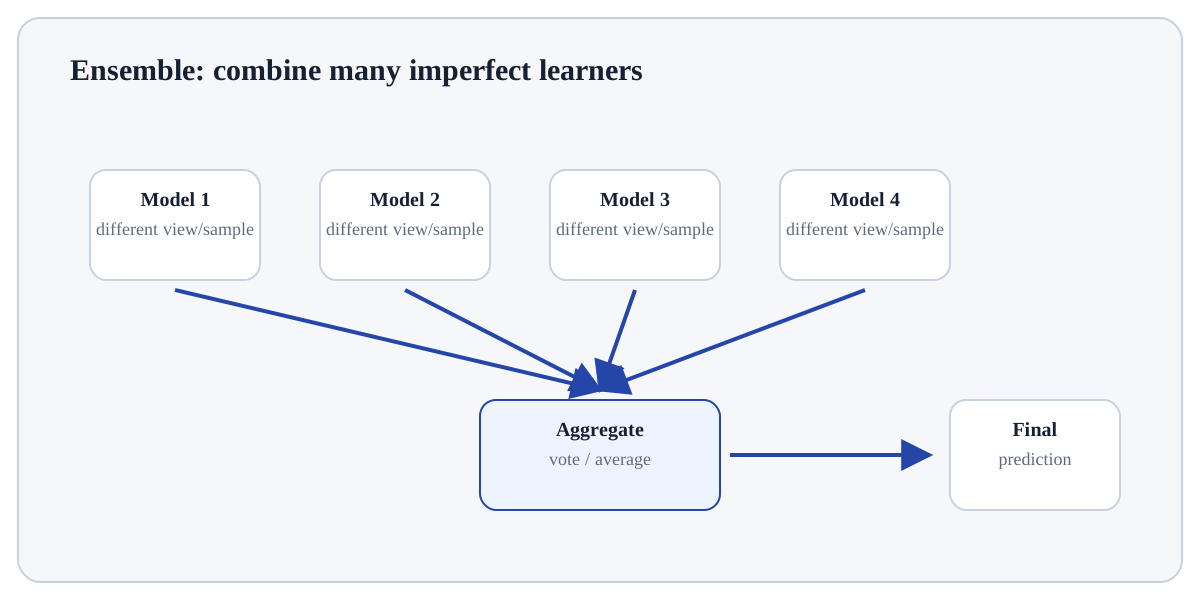
Random Forest builds many deliberately different trees and averages/votes their predictions. Diversity reduces the variance that makes a single deep tree unstable.
Building interactive view…
Understand
Build the mental model
Random Forest builds many deliberately different trees and averages/votes their predictions. Diversity reduces the variance that makes a single deep tree unstable. Strong default for tabular data. Tune tree size/depth/features, inspect OOB or CV performance, and treat impurity importance cautiously.
Click a stage to inspect what happens, what changes, and what should be checked before moving on.
Stage 1
Bootstrap samples
For the “Bootstrap samples” stage, identify the incoming object, the rule applied to it, the state change produced, and the evidence that would reveal a mistake. Technical context for Random Forest: Bootstrap sampling varies training rows; random feature subsets decorrelate tree structures. Averaging reduces variance most when individual errors are not perfectly correlated.
Practitioner checkpoint: Strong default for tabular data. Tune tree size/depth/features, inspect OOB or CV performance, and treat impurity importance cautiously.
What happens if…?
Break the assumption deliberately
Increase tree correlation by removing feature randomness and observe why averaging helps less.
Move the control and explain what you expect before reading the visual.
Technical lens
Formalise what the visual is doing
Bootstrap sampling varies training rows; random feature subsets decorrelate tree structures. Averaging reduces variance most when individual errors are not perfectly correlated.
Technical questionUse a tiny case to make the mechanism observable. Bootstrap sampling varies training rows; random feature subsets decorrelate tree structures. Averaging reduces variance most when individual errors are not perfectly correlated. Verify one intermediate quantity, state change or mapping independently; then predict the consequence of this change: Increase tree correlation by removing feature randomness and observe why averaging helps less.
Practitioner lens
Use it responsibly
Strong default for tabular data. Tune tree size/depth/features, inspect OOB or CV performance, and treat impurity importance cautiously.
Transfer testTransfer this idea to a new example and justify each decision using this practitioner rule: Strong default for tabular data. Tune tree size/depth/features, inspect OOB or CV performance, and treat impurity importance cautiously. Then explain what should change if you deliberately test: Increase tree correlation by removing feature randomness and observe why averaging helps less.
Worked exploration
Use the visual as an experiment, not decoration
Train several trees on different bootstrap samples and random feature subsets. Compare their individual predictions and then average/vote. The ensemble is more stable because tree errors are not perfectly correlated.
Technical lens
Bootstrap sampling varies training rows; random feature subsets decorrelate tree structures. Averaging reduces variance most when individual errors are not perfectly correlated.
Practitioner check
Strong default for tabular data. Tune tree size/depth/features, inspect OOB or CV performance, and treat impurity importance cautiously.
Prediction before interaction
Increase tree correlation by removing feature randomness and observe why averaging helps less.
Exploration walkthrough
Turn the interaction into an evidence trail
Train several trees on different bootstrap samples and random feature subsets. Compare their individual predictions and then average/vote. The ensemble is more stable because tree errors are not perfectly correlated. Before moving the control, state your prediction. After the visual changes, name the specific state, statistic, boundary or mapping that changed and explain why that change is consistent—or inconsistent—with your prediction.
Record one observable quantity before the interaction and the same quantity afterwards.
Change one factor at a time so the causal effect of the control is inspectable.
Use an edge or failure case to discover where the concept stops behaving as the simple story suggests.
Static orientation diagram for Random Forest; use the interactive visual above to test how the relationships change.
Reference depth
Open the complete material
The flagship experience is the map. These pages contain the roads.